MatheMatica 绘制鸟巢体育馆
背景
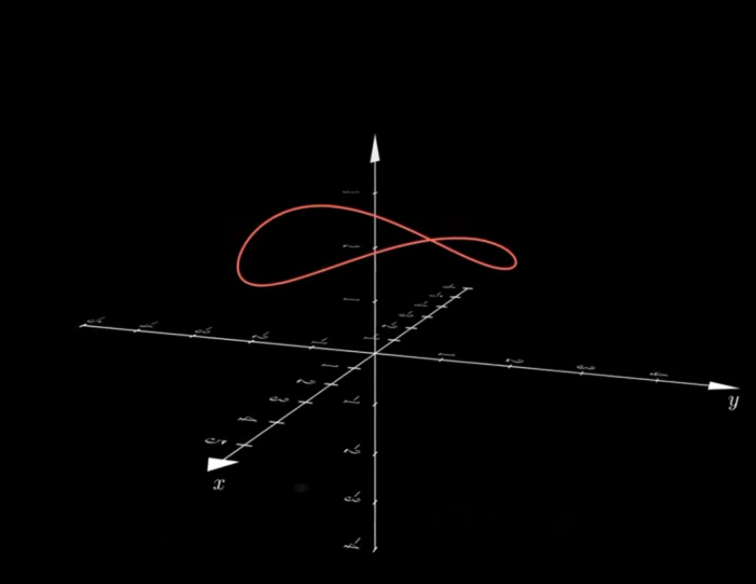
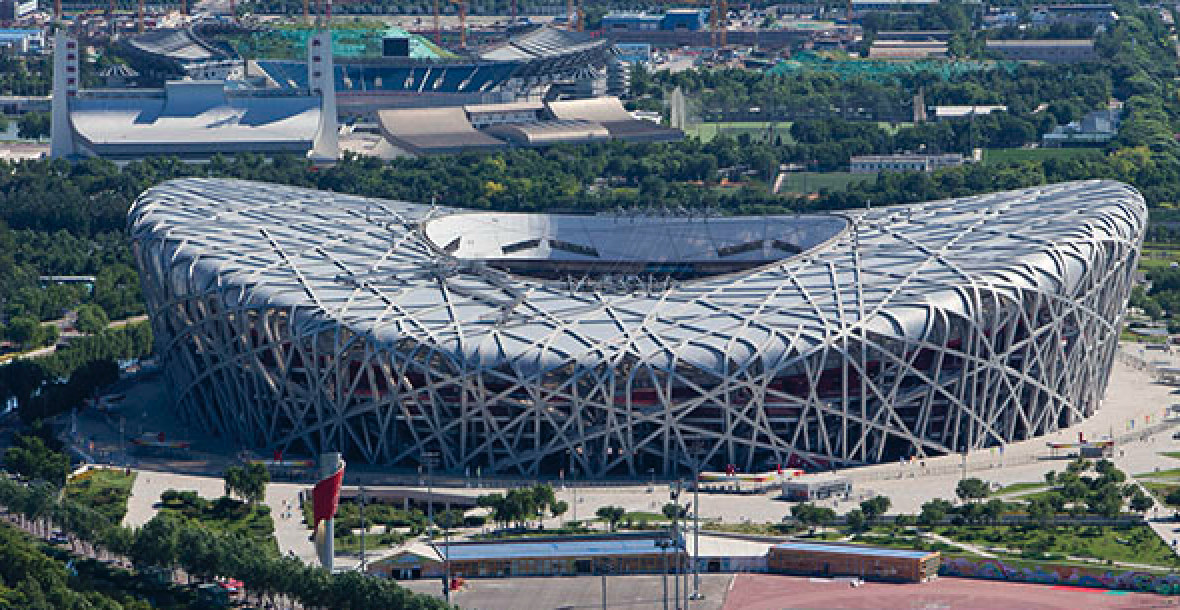
YouTube 上刷到一个用 manim 做的实验动画——3D 图形投影到 xy 平面,效果挺有意思。其数学原理是使用三角函数绘制凸凹的椭圆曲线,最近在学 MatheMatica,拿它来练练手。不过光是照搬太单调,不如发挥一下,把它变成一个“鸟巢”造型。
绘制流程
最好先搞清几个关键形状的数学原理,比如中间内凹的椭圆、穿过四个点的曲线等。
icon

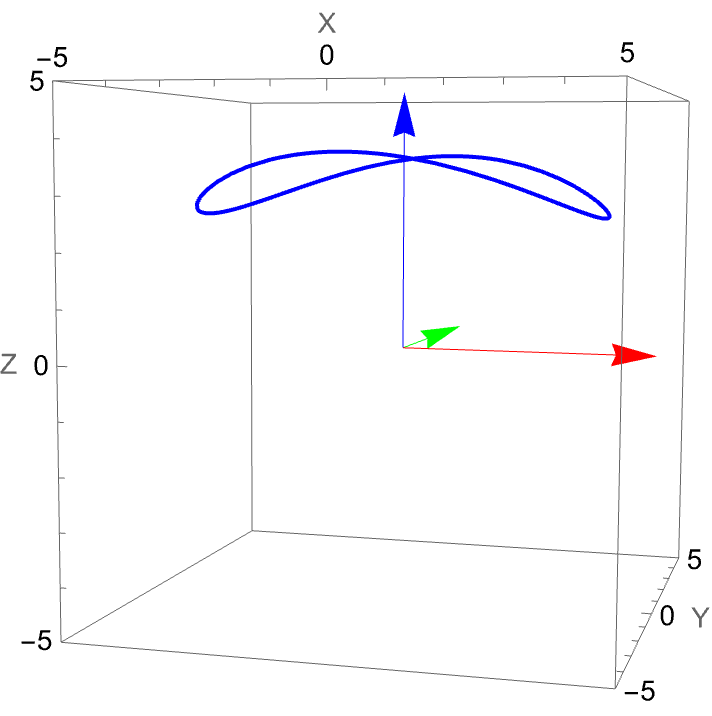
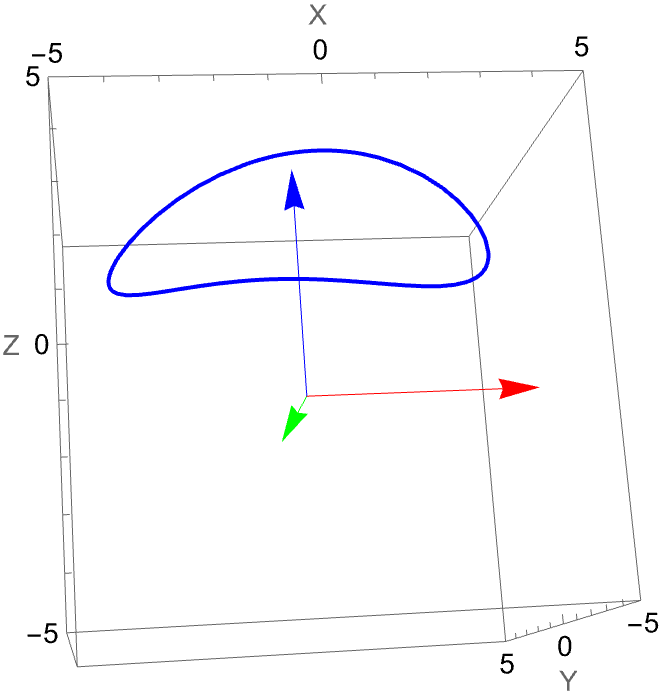
mathematica 绘制中间内凹的椭圆
椭圆绘制基于参数方程 r(t)=( 2 cos(t), 2 sin(t), 0.5 sin(2 t) + 2 ) ,通过调整参数即可得到不同的形态。 该椭圆由参数方程 r(t)=(2cost,2sint,0.5sin(2t)+2)r(t)=(2cost,2sint,0.5sin(2t)+2) 通过调整参数生成。
curve = ParametricPlot3D[{4 Cos[t], 4.2 Sin[t], 0.6 Sin[2 t + Pi + Pi/2] + 3.2}, {t, 0, 2 Pi}, PlotStyle -> {Thick, Blue}, PlotRange -> {{-5, 5}, {-5, 5}, {-5, 5}}, BoxRatios -> {1, 1, 1}]; axes = Graphics3D[{Arrowheads[0.05], {Red, Arrow[{{0, 0, 0}, {5, 0, 0}}]},(*X 轴*){Green, Arrow[{{0, 0, 0}, {0, 5, 0}}]},(*Y 轴*){Blue, Arrow[{{0, 0, 0}, {0, 0, 5}}]} (*Z 轴*)}]; png = Show[curve, axes, AxesLabel -> {"X", "Y", "Z"}, LabelStyle -> {FontSize -> 14}, Boxed -> True]mathematica 绘制鸟巢几条主要的轮廓线
curve12 = ParametricPlot3D[{2 Cos[t], 1.5 Sin[t], 0.2 Sin[2 t + Pi + Pi/2] + 3}, {t, 0, 2 Pi}, PlotStyle -> {Thick, Blue}, PlotRange -> {{-5, 5}, {-5, 5}, {-5, 5}}, BoxRatios -> {1, 1, 1}];curve21 = ParametricPlot3D[{4 Cos[t], 4.2 Sin[t], 0.6 Sin[2 t + Pi + Pi/2] + 3.2}, {t, 0, 2 Pi}, PlotStyle -> {Thick, Blue}, PlotRange -> {{-5, 5}, {-5, 5}, {-5, 5}}, BoxRatios -> {1, 1, 1}];curve22 = ParametricPlot3D[{4.2 Cos[t], 4.4 Sin[t], 0.6 Sin[2 t + Pi + Pi/2] + 2.5}, {t, 0, 2 Pi}, PlotStyle -> {Thick, Blue}, PlotRange -> {{-5, 5}, {-5, 5}, {-5, 5}}, BoxRatios -> {1, 1, 1}];curve31 = ParametricPlot3D[{3.4 Cos[t], 3.8 Sin[t], 0}, {t, 0, 2 \[Pi]}, PlotStyle -> {Thick, Blue}, Axes -> False, PlotRange -> {{-5, 5}, {-5, 5}, {-5, 5}}, BoxRatios -> {1, 1, 1}]; axes = Graphics3D[{Arrowheads[0.05], {Red, Arrow[{{0, 0, 0}, {5, 0, 0}}]},(*X 轴*){Green, Arrow[{{0, 0, 0}, {0, 5, 0}}]},(*Y 轴*){Blue, Arrow[{{0, 0, 0}, {0, 0, 5}}]} (*Z 轴*)}]; png = Show[curve12, curve21, curve22, curve31, axes, AxesLabel -> {"X", "Y", "Z"}, LabelStyle -> {FontSize -> 14}, Boxed -> True]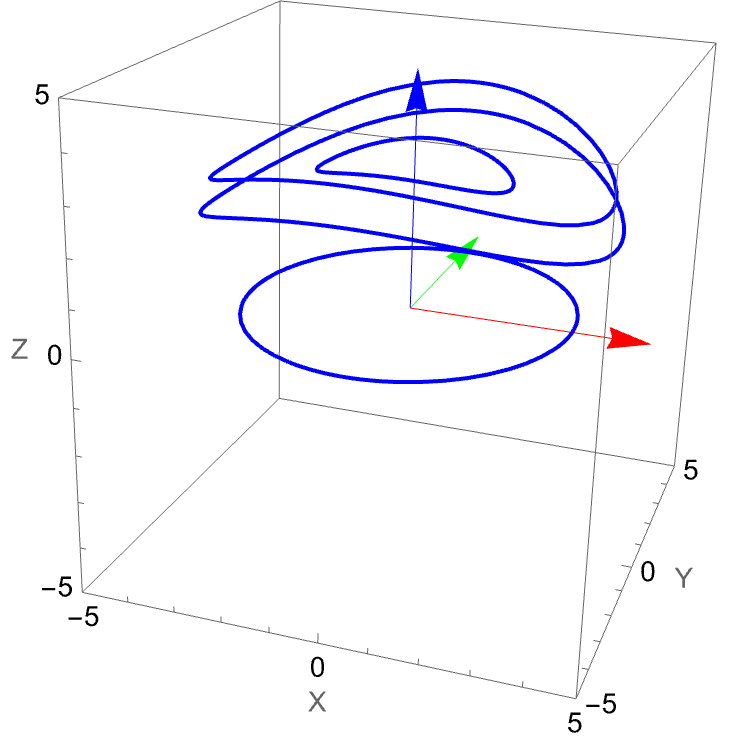
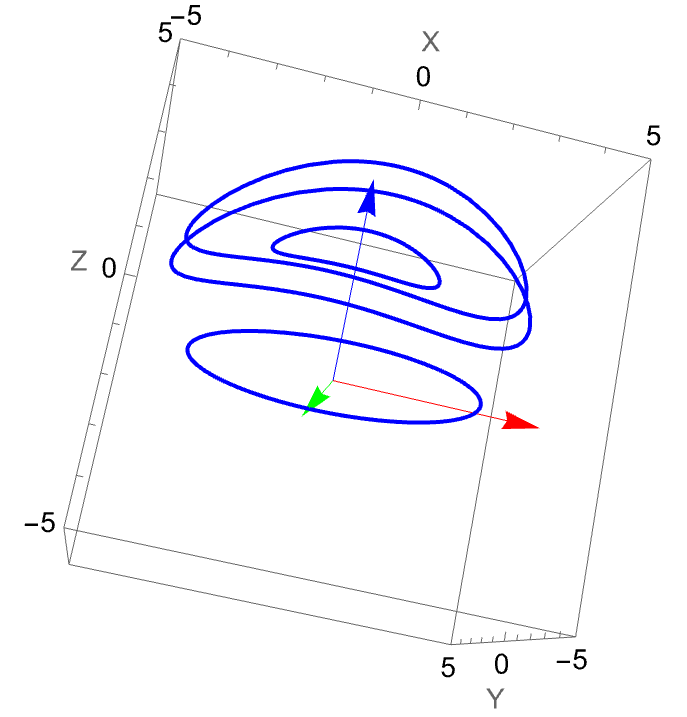
mathematica 四段曲线上分别选取一个点,连接成线
curve12 = ParametricPlot3D[{2 Cos[t], 1.5 Sin[t], 0.2 Sin[2 t + Pi + Pi/2] + 3}, {t, 0, 2 Pi}, PlotStyle -> {Thick, Blue}, PlotRange -> {{-5, 5}, {-5, 5}, {-5, 5}}, BoxRatios -> {1, 1, 1}]; curve21 = ParametricPlot3D[{4 Cos[t], 4.2 Sin[t], 0.6 Sin[2 t + Pi + Pi/2] + 3.2}, {t, 0, 2 Pi}, PlotStyle -> {Thick, Blue}, PlotRange -> {{-5, 5}, {-5, 5}, {-5, 5}}, BoxRatios -> {1, 1, 1}]; curve22 = ParametricPlot3D[{4.2 Cos[t], 4.4 Sin[t], 0.6 Sin[2 t + Pi + Pi/2] + 2.5}, {t, 0, 2 Pi}, PlotStyle -> {Thick, Blue}, PlotRange -> {{-5, 5}, {-5, 5}, {-5, 5}}, BoxRatios -> {1, 1, 1}]; curve31 = ParametricPlot3D[{3.4 Cos[t], 3.8 Sin[t], 0}, {t, 0, 2 \[Pi]}, PlotStyle -> {Thick, Blue}, Axes -> False, PlotRange -> {{-5, 5}, {-5, 5}, {-5, 5}}, BoxRatios -> {1, 1, 1}]; axes = Graphics3D[{Arrowheads[0.05], {Red, Arrow[{{0, 0, 0}, {5, 0, 0}}]},(*X 轴*){Green, Arrow[{{0, 0, 0}, {0, 5, 0}}]},(*Y 轴*){Blue, Arrow[{{0, 0, 0}, {0, 0, 5}}]} (*Z 轴*)}]; p1 = {2 Cos[0], 1.5 Sin[0], 0.2 Sin[2*0 + Pi + Pi/2] + 3}; (*curve12 上的点*)p2 = {4 Cos[0], 4.2 Sin[0], 0.6 Sin[2*0 + Pi + Pi/2] + 3.2}; (*curve21 上的点*)p3 = {4.2 Cos[0], 4.4 Sin[0], 0.6 Sin[2*0 + Pi + Pi/2] + 2.5}; (*curve22 上的点*)p4 = {3.4 Cos[0], 3.8 Sin[0], 0}; (*curve31 上的点*) (*连接四个点绘制红色直线*)connector = Graphics3D[{Thick, Red, Line[{p1, p2, p3, p4}],(*连接四个点的折线*) PointSize[0.02], {Black, Point[p1]},(*点1:黑色*){Black, Point[p2]},(*点2:黑色*){Black, Point[p3]},(*点3:黑色*){Black, Point[p4]} (*点4:黑色*)}]; png = Show[curve12, curve21, curve22, curve31, axes, connector, AxesLabel -> {"X", "Y", "Z"}, LabelStyle -> {FontSize -> 14}, Boxed -> True]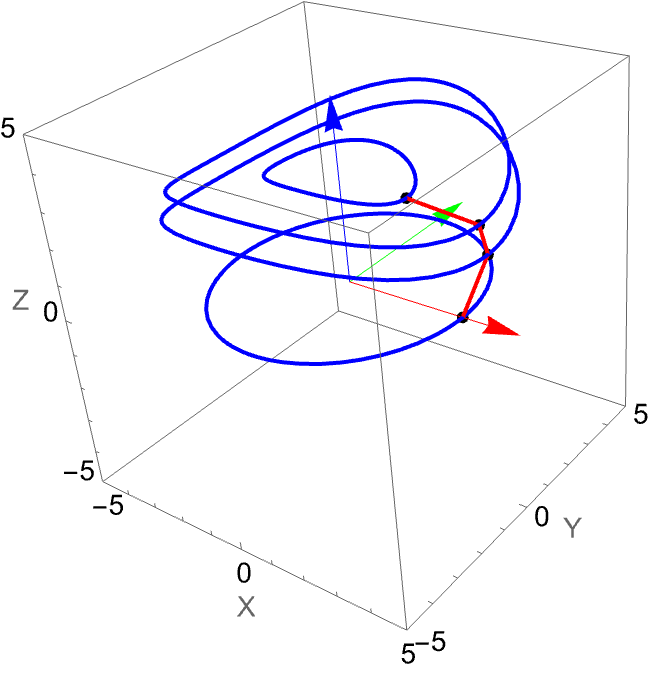
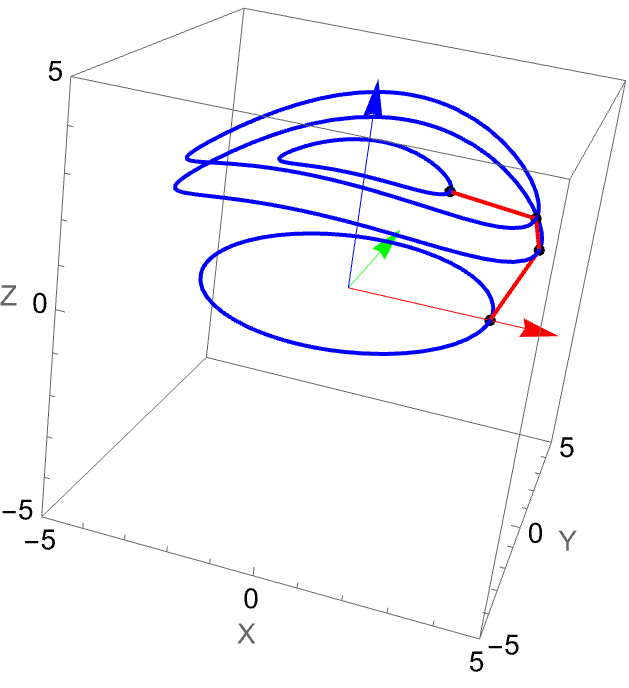
mathematica 四段曲线上分别选取一个点,直线替换为曲线
curve12 = ParametricPlot3D[{2 Cos[t], 1.5 Sin[t], 0.2 Sin[2 t + Pi + Pi/2] + 3}, {t, 0, 2 Pi}, PlotStyle -> {Thick, Blue}, PlotRange -> {{-5, 5}, {-5, 5}, {-5, 5}}, BoxRatios -> {1, 1, 1}];curve21 = ParametricPlot3D[{4 Cos[t], 4.2 Sin[t], 0.6 Sin[2 t + Pi + Pi/2] + 3.2}, {t, 0, 2 Pi}, PlotStyle -> {Thick, Blue}, PlotRange -> {{-5, 5}, {-5, 5}, {-5, 5}}, BoxRatios -> {1, 1, 1}];curve22 = ParametricPlot3D[{4.2 Cos[t], 4.4 Sin[t], 0.6 Sin[2 t + Pi + Pi/2] + 2.5}, {t, 0, 2 Pi}, PlotStyle -> {Thick, Blue}, PlotRange -> {{-5, 5}, {-5, 5}, {-5, 5}}, BoxRatios -> {1, 1, 1}];curve31 = ParametricPlot3D[{3.4 Cos[t], 3.8 Sin[t], 0}, {t, 0, 2 \[Pi]}, PlotStyle -> {Thick, Blue}, Axes -> False, PlotRange -> {{-5, 5}, {-5, 5}, {-5, 5}}, BoxRatios -> {1, 1, 1}]; axes = Graphics3D[{Arrowheads[0.05], {Red, Arrow[{{0, 0, 0}, {5, 0, 0}}]},(*X 轴*){Green, Arrow[{{0, 0, 0}, {0, 5, 0}}]},(*Y 轴*){Blue, Arrow[{{0, 0, 0}, {0, 0, 5}}]} (*Z 轴*)}]; p1 = {2 Cos[0], 1.5 Sin[0], 0.2 Sin[2*0 + Pi + Pi/2] + 3}; (*curve12 上的点*)p2 = {4 Cos[0], 4.2 Sin[0], 0.6 Sin[2*0 + Pi + Pi/2] + 3.2}; (*curve21 上的点*)p3 = {4.2 Cos[0], 4.4 Sin[0], 0.6 Sin[2*0 + Pi + Pi/2] + 2.5}; (*curve22 上的点*)p4 = {3.4 Cos[0], 3.8 Sin[0], 0}; (*curve31 上的点*) catmullRom3D[{p0_, p1_, p2_, p3_}, t_] := 0.5*{2 p1[[1]] + t (p2[[1]] - p0[[1]]) + t^2 (2 p0[[1]] - 5 p1[[1]] + 4 p2[[1]] - p3[[1]]) + t^3 (-p0[[1]] + 3 p1[[1]] - 3 p2[[1]] + p3[[1]]), 2 p1[[2]] + t (p2[[2]] - p0[[2]]) + t^2 (2 p0[[2]] - 5 p1[[2]] + 4 p2[[2]] - p3[[2]]) + t^3 (-p0[[2]] + 3 p1[[2]] - 3 p2[[2]] + p3[[2]]), 2 p1[[3]] + t (p2[[3]] - p0[[3]]) + t^2 (2 p0[[3]] - 5 p1[[3]] + 4 p2[[3]] - p3[[3]]) + t^3 (-p0[[3]] + 3 p1[[3]] - 3 p2[[3]] + p3[[3]])}; pts = {p1, p2, p3, p4};newPts = Join[{2.1 pts[[1]] - pts[[2]]}, pts, {2.2 pts[[-1]] - pts[[-2]]}]; curvePoints3D = Table[catmullRom3D[{p1, p2, p3, p4}, t], {t, 0, 1, 0.1}]; curve = Graphics3D[{{Thick, Blue, Line[curvePoints3D]}, {Black, PointSize[0.02], Point[{p1, p1, p2, p3}]}, {Dashed, Gray, Line[{p1, p1, p2, p3}]}}]; png = Show[curve, curve12, curve21, curve22, curve31, axes, AxesLabel -> {"X", "Y", "Z"}, LabelStyle -> {FontSize -> 14}, Boxed -> True]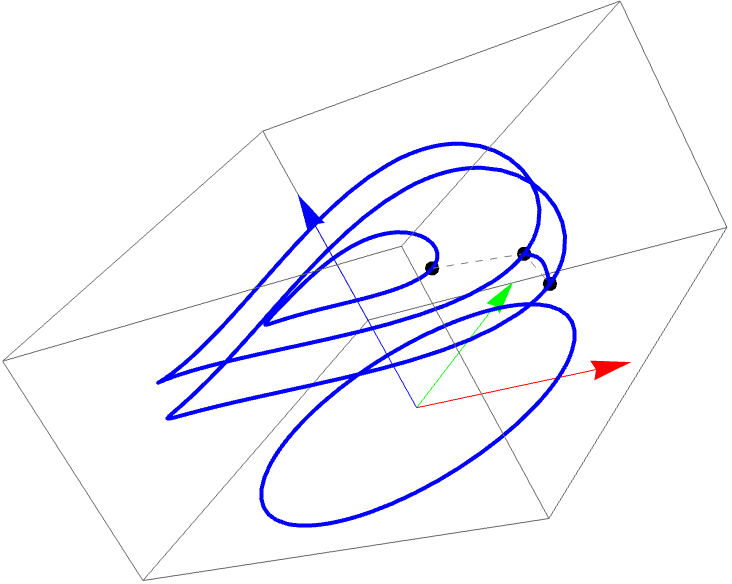
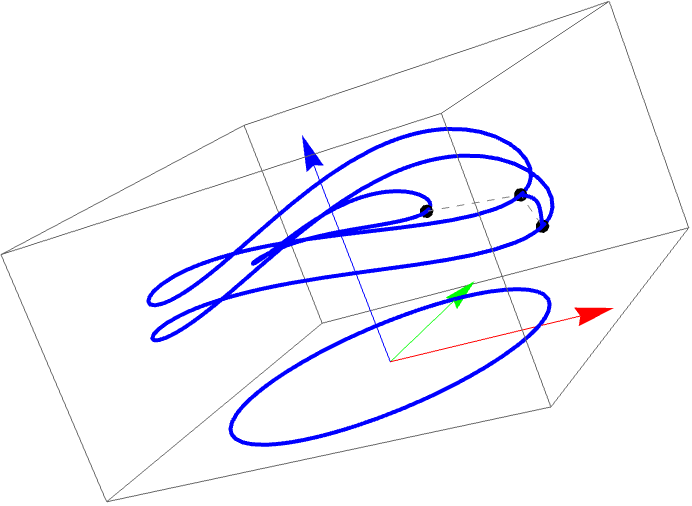
mathematica 四段曲线上分别选取一个点,添加两个辅助点,直线替换为曲线
curve12 = ParametricPlot3D[{2 Cos[t], 1.5 Sin[t], 0.2 Sin[2 t + Pi + Pi/2] + 3}, {t, 0, 2 Pi}, PlotStyle -> {Thick, Blue}, PlotRange -> {{-5, 5}, {-5, 5}, {-5, 5}}, BoxRatios -> {1, 1, 1}];curve21 = ParametricPlot3D[{4 Cos[t], 4.2 Sin[t], 0.6 Sin[2 t + Pi + Pi/2] + 3.2}, {t, 0, 2 Pi}, PlotStyle -> {Thick, Blue}, PlotRange -> {{-5, 5}, {-5, 5}, {-5, 5}}, BoxRatios -> {1, 1, 1}];curve22 = ParametricPlot3D[{4.2 Cos[t], 4.4 Sin[t], 0.6 Sin[2 t + Pi + Pi/2] + 2.5}, {t, 0, 2 Pi}, PlotStyle -> {Thick, Blue}, PlotRange -> {{-5, 5}, {-5, 5}, {-5, 5}}, BoxRatios -> {1, 1, 1}];curve31 = ParametricPlot3D[{3.4 Cos[t], 3.8 Sin[t], 0}, {t, 0, 2 \[Pi]}, PlotStyle -> {Thick, Blue}, Axes -> False, PlotRange -> {{-5, 5}, {-5, 5}, {-5, 5}}, BoxRatios -> {1, 1, 1}]; axes = Graphics3D[{Arrowheads[0.05], {Red, Arrow[{{0, 0, 0}, {5, 0, 0}}]},(*X 轴*){Green, Arrow[{{0, 0, 0}, {0, 5, 0}}]},(*Y 轴*){Blue, Arrow[{{0, 0, 0}, {0, 0, 5}}]} (*Z 轴*)}]; p1 = {2 Cos[0], 1.5 Sin[0], 0.2 Sin[2*0 + Pi + Pi/2] + 3}; (*curve12 上的点*)p2 = {4 Cos[0], 4.2 Sin[0], 0.6 Sin[2*0 + Pi + Pi/2] + 3.2}; (*curve21 上的点*)p3 = {4.2 Cos[0], 4.4 Sin[0], 0.6 Sin[2*0 + Pi + Pi/2] + 2.5}; (*curve22 上的点*)p4 = {3.4 Cos[0], 3.8 Sin[0], 0}; (*curve31 上的点*) catmullRom3D[{p0_, p1_, p2_, p3_}, t_] := 0.5*{2 p1[[1]] + t (p2[[1]] - p0[[1]]) + t^2 (2 p0[[1]] - 5 p1[[1]] + 4 p2[[1]] - p3[[1]]) + t^3 (-p0[[1]] + 3 p1[[1]] - 3 p2[[1]] + p3[[1]]), 2 p1[[2]] + t (p2[[2]] - p0[[2]]) + t^2 (2 p0[[2]] - 5 p1[[2]] + 4 p2[[2]] - p3[[2]]) + t^3 (-p0[[2]] + 3 p1[[2]] - 3 p2[[2]] + p3[[2]]), 2 p1[[3]] + t (p2[[3]] - p0[[3]]) + t^2 (2 p0[[3]] - 5 p1[[3]] + 4 p2[[3]] - p3[[3]]) + t^3 (-p0[[3]] + 3 p1[[3]] - 3 p2[[3]] + p3[[3]])}; pts = {p1, p2, p3, p4};curvePoints3D = Table[catmullRom3D[{p1, p2, p3, p4}, t], {t, 0, 1, 0.1}]; newPts = Join[{2.1 pts[[1]] - pts[[2]]}, pts, {2.2 pts[[-1]] - pts[[-2]]}];crPts = Flatten[ Table[Table[ catmullRom3D[newPts[[i ;; i + 3]], s], {s, 0, 1, 0.1}], {i, 1, Length[newPts] - 3}], 1]; curve = Graphics3D[{{Thick, Blue, Line[crPts]}, {Black, PointSize[0.02], Point[{p1, p1, p2, p3}]}, {Dashed, Gray, Line[{p1, p1, p2, p3}]}}]; png = Show[curve, curve12, curve21, curve22, curve31, axes, AxesLabel -> {"X", "Y", "Z"}, LabelStyle -> {FontSize -> 14}, Boxed -> True]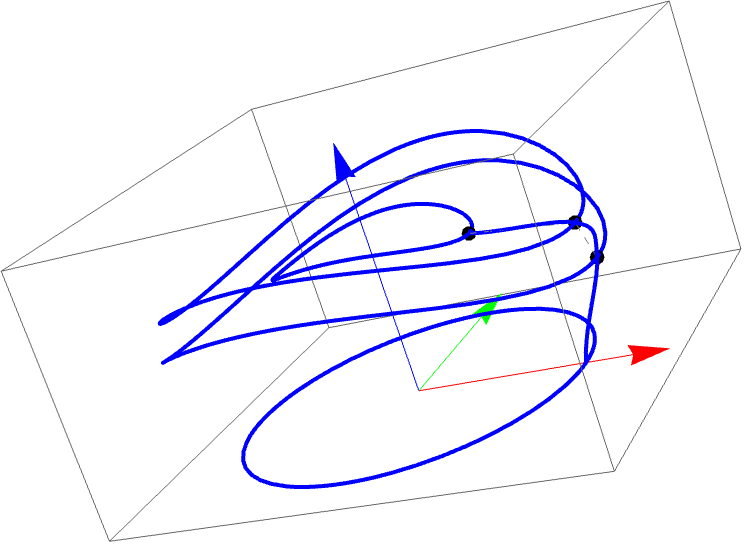
mathematica 绘制一圈曲线
curve12 = ParametricPlot3D[{2 Cos[t], 1.5 Sin[t], 0.2 Sin[2 t + Pi + Pi/2] + 3}, {t, 0, 2 Pi}, PlotStyle -> {Thick, Blue}, PlotRange -> {{-5, 5}, {-5, 5}, {-5, 5}}, BoxRatios -> {1, 1, 1}];curve21 = ParametricPlot3D[{4 Cos[t], 4.2 Sin[t], 0.6 Sin[2 t + Pi + Pi/2] + 3.2}, {t, 0, 2 Pi}, PlotStyle -> {Thick, Blue}, PlotRange -> {{-5, 5}, {-5, 5}, {-5, 5}}, BoxRatios -> {1, 1, 1}];curve22 = ParametricPlot3D[{4.2 Cos[t], 4.4 Sin[t], 0.6 Sin[2 t + Pi + Pi/2] + 2.5}, {t, 0, 2 Pi}, PlotStyle -> {Thick, Blue}, PlotRange -> {{-5, 5}, {-5, 5}, {-5, 5}}, BoxRatios -> {1, 1, 1}];curve31 = ParametricPlot3D[{3.4 Cos[t], 3.8 Sin[t], 0}, {t, 0, 2 \[Pi]}, PlotStyle -> {Thick, Blue}, Axes -> False, PlotRange -> {{-5, 5}, {-5, 5}, {-5, 5}}, BoxRatios -> {1, 1, 1}]; axes = Graphics3D[{Arrowheads[0.05], {Red, Arrow[{{0, 0, 0}, {5, 0, 0}}]},(*X 轴*){Green, Arrow[{{0, 0, 0}, {0, 5, 0}}]},(*Y 轴*){Blue, Arrow[{{0, 0, 0}, {0, 0, 5}}]} (*Z 轴*)}]; catmullRom3D[{p0_, p1_, p2_, p3_}, t_] := 0.5*{2 p1[[1]] + t (p2[[1]] - p0[[1]]) + t^2 (2 p0[[1]] - 5 p1[[1]] + 4 p2[[1]] - p3[[1]]) + t^3 (-p0[[1]] + 3 p1[[1]] - 3 p2[[1]] + p3[[1]]), 2 p1[[2]] + t (p2[[2]] - p0[[2]]) + t^2 (2 p0[[2]] - 5 p1[[2]] + 4 p2[[2]] - p3[[2]]) + t^3 (-p0[[2]] + 3 p1[[2]] - 3 p2[[2]] + p3[[2]]), 2 p1[[3]] + t (p2[[3]] - p0[[3]]) + t^2 (2 p0[[3]] - 5 p1[[3]] + 4 p2[[3]] - p3[[3]]) + t^3 (-p0[[3]] + 3 p1[[3]] - 3 p2[[3]] + p3[[3]])}; offset = 0;step = 0.25crOneOffsets = {0 + offset, -Pi/16 + offset, -Pi/28 + offset, Pi/8 + offset};crOneTs = Range[0, 2 Pi - step, step]; (*curve31 上的点*)crOneConnectors = Table[random = RandomReal[{1, 15}]*0.02; p1 = {2 Cos[t + crOneOffsets[[1]] + random], 1.5 Sin[t + crOneOffsets[[1]] + random], 0.2 Sin[2 (t + crOneOffsets[[1]]) + 3 Pi/2] + 3}; p2 = {4 Cos[t + crOneOffsets[[2]]], 4.2 Sin[t + crOneOffsets[[2]]], 0.6 Sin[2 (t + crOneOffsets[[2]]) + 3 Pi/2] + 3.2}; p3 = {4.2 Cos[t + crOneOffsets[[3]]], 4.4 Sin[t + crOneOffsets[[3]]], 0.6 Sin[2 (t + crOneOffsets[[3]]) + 3 Pi/2] + 2.5}; p4 = {3.4 Cos[t + crOneOffsets[[4]] + random], 3.8 Sin[t + crOneOffsets[[4]] + random], 0}; pts = {p1, p2, p3, p4}; newPts = Join[{2.1 pts[[1]] - pts[[2]]}, pts, {2.2 pts[[-1]] - pts[[-2]]}]; crPts = Flatten[Table[ Table[catmullRom3D[newPts[[i ;; i + 3]], s], {s, 0, 1, 1/30}], {i, 1, Length[newPts] - 3}], 1]; (*4. 绘制这一段的 CR 曲线+原控制点*){Thick, Opacity[0.7], Blue, Line[crPts], Black, PointSize[0.015], Point[pts]}, {t, crOneTs}]; png = Show[Graphics3D[crOneConnectors], curve12, curve21, curve22, curve31, axes, Axes -> True, AxesLabel -> {"X", "Y", "Z"}, PlotRange -> {{-5, 5}, {-5, 5}, {-5, 5}}, BoxRatios -> {1, 1, 1}, ImageSize -> Large, PlotLabel -> "Bird's Nest"]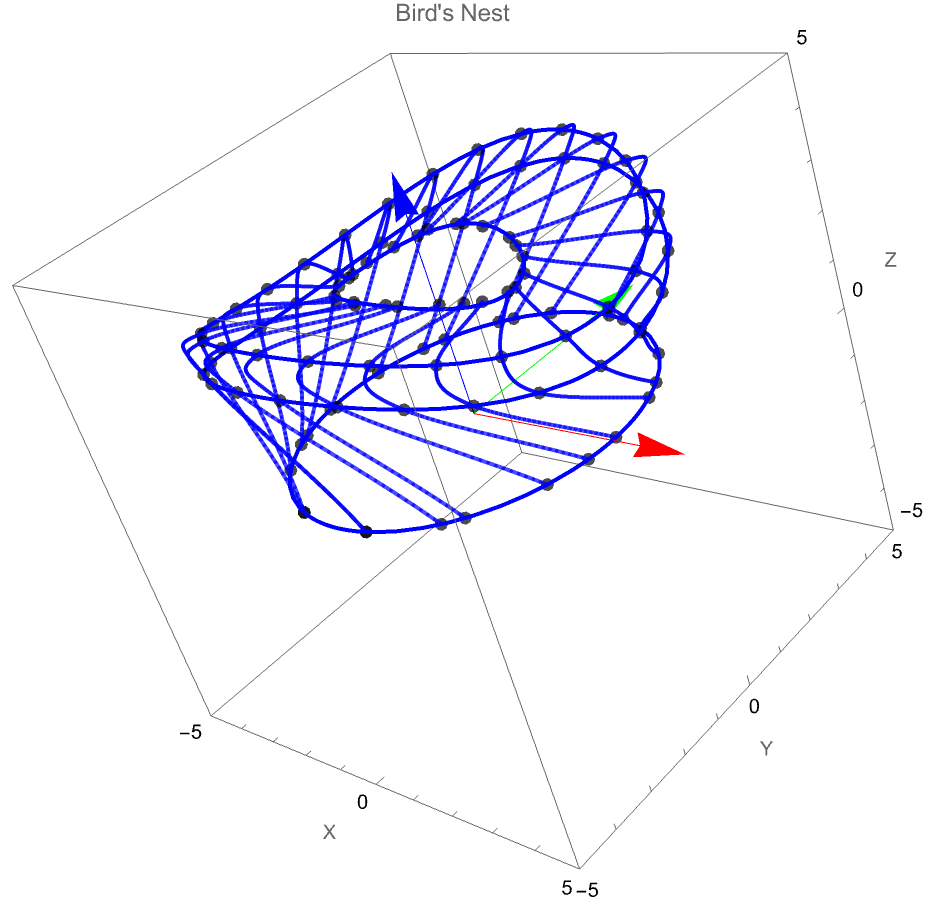
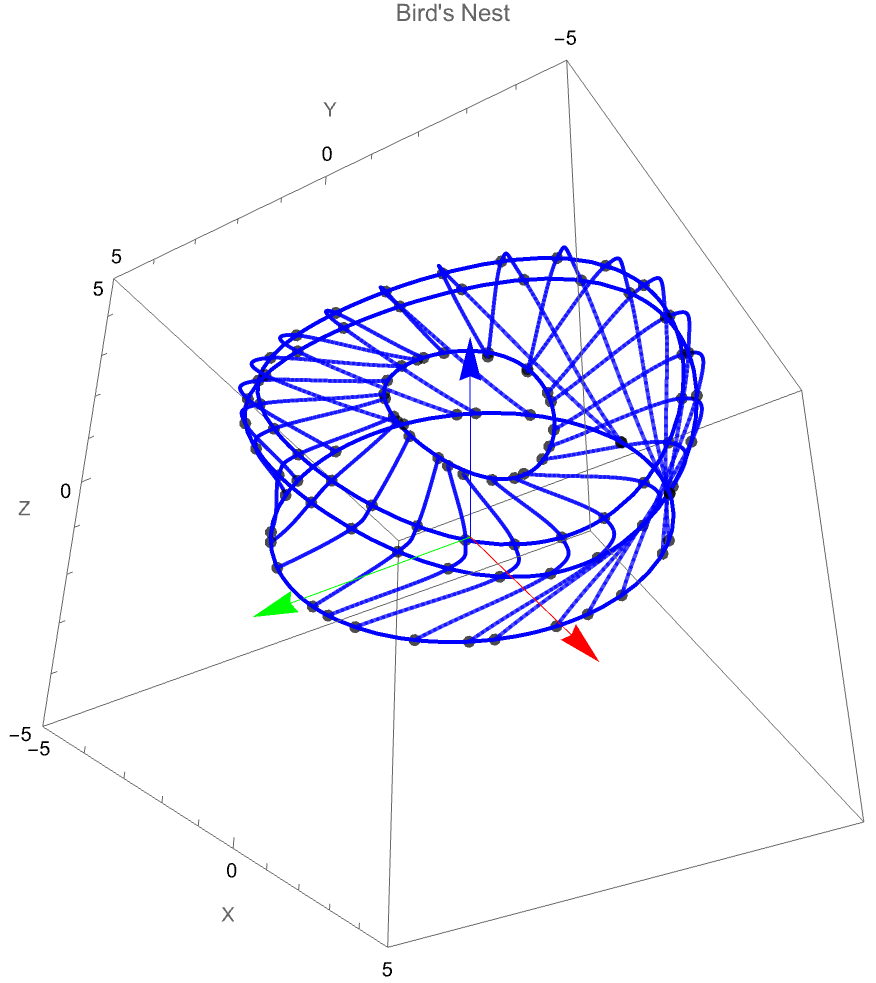
mathematica 以此类推,绘制更多
curve12 = ParametricPlot3D[{2 Cos[t], 1.5 Sin[t], 0.2 Sin[2 t + Pi + Pi/2] + 3}, {t, 0, 2 Pi}, PlotStyle -> {Thick, Blue}, PlotRange -> {{-5, 5}, {-5, 5}, {-5, 5}}, BoxRatios -> {1, 1, 1}];curve21 = ParametricPlot3D[{4 Cos[t], 4.2 Sin[t], 0.6 Sin[2 t + Pi + Pi/2] + 3.2}, {t, 0, 2 Pi}, PlotStyle -> {Thick, Blue}, PlotRange -> {{-5, 5}, {-5, 5}, {-5, 5}}, BoxRatios -> {1, 1, 1}];curve22 = ParametricPlot3D[{4.2 Cos[t], 4.4 Sin[t], 0.6 Sin[2 t + Pi + Pi/2] + 2.5}, {t, 0, 2 Pi}, PlotStyle -> {Thick, Blue}, PlotRange -> {{-5, 5}, {-5, 5}, {-5, 5}}, BoxRatios -> {1, 1, 1}];curve31 = ParametricPlot3D[{3.4 Cos[t], 3.8 Sin[t], 0}, {t, 0, 2 \[Pi]}, PlotStyle -> {Thick, Blue}, Axes -> False, PlotRange -> {{-5, 5}, {-5, 5}, {-5, 5}}, BoxRatios -> {1, 1, 1}]; axes = Graphics3D[{Arrowheads[0.05], {Red, Arrow[{{0, 0, 0}, {5, 0, 0}}]},(*X 轴*){Green, Arrow[{{0, 0, 0}, {0, 5, 0}}]},(*Y 轴*){Blue, Arrow[{{0, 0, 0}, {0, 0, 5}}]} (*Z 轴*)}]; catmullRom3D[{p0_, p1_, p2_, p3_}, t_] := 0.5*{2 p1[[1]] + t (p2[[1]] - p0[[1]]) + t^2 (2 p0[[1]] - 5 p1[[1]] + 4 p2[[1]] - p3[[1]]) + t^3 (-p0[[1]] + 3 p1[[1]] - 3 p2[[1]] + p3[[1]]), 2 p1[[2]] + t (p2[[2]] - p0[[2]]) + t^2 (2 p0[[2]] - 5 p1[[2]] + 4 p2[[2]] - p3[[2]]) + t^3 (-p0[[2]] + 3 p1[[2]] - 3 p2[[2]] + p3[[2]]), 2 p1[[3]] + t (p2[[3]] - p0[[3]]) + t^2 (2 p0[[3]] - 5 p1[[3]] + 4 p2[[3]] - p3[[3]]) + t^3 (-p0[[3]] + 3 p1[[3]] - 3 p2[[3]] + p3[[3]])}; offset = 0;step = 0.25crOneOffsets = {0 + offset, -Pi/16 + offset, -Pi/28 + offset, Pi/8 + offset};crOneTs = Range[0, 2 Pi - step, step]; (*curve31 上的点*)crOneConnectors = Table[random = RandomReal[{1, 15}]*0.02; p1 = {2 Cos[t + crOneOffsets[[1]] + random], 1.5 Sin[t + crOneOffsets[[1]] + random], 0.2 Sin[2 (t + crOneOffsets[[1]]) + 3 Pi/2] + 3}; p2 = {4 Cos[t + crOneOffsets[[2]]], 4.2 Sin[t + crOneOffsets[[2]]], 0.6 Sin[2 (t + crOneOffsets[[2]]) + 3 Pi/2] + 3.2}; p3 = {4.2 Cos[t + crOneOffsets[[3]]], 4.4 Sin[t + crOneOffsets[[3]]], 0.6 Sin[2 (t + crOneOffsets[[3]]) + 3 Pi/2] + 2.5}; p4 = {3.4 Cos[t + crOneOffsets[[4]] + random], 3.8 Sin[t + crOneOffsets[[4]] + random], 0}; pts = {p1, p2, p3, p4}; newPts = Join[{2.1 pts[[1]] - pts[[2]]}, pts, {2.2 pts[[-1]] - pts[[-2]]}]; crPts = Flatten[Table[ Table[catmullRom3D[newPts[[i ;; i + 3]], s], {s, 0, 1, 1/30}], {i, 1, Length[newPts] - 3}], 1]; (*4. 绘制这一段的 CR 曲线+原控制点*){Thick, Opacity[0.7], Blue, Line[crPts], Black, PointSize[0.015], Point[pts]}, {t, crOneTs}]; crOneConnectors1 = Table[random = RandomReal[{1, 15}]*0.02; p1 = {2 Cos[t + crOneOffsets[[1]] + random], 1.5 Sin[t + crOneOffsets[[1]] + random], 0.2 Sin[2 (t + crOneOffsets[[1]] + random) + 3 Pi/2] + 3}; p2 = {4 Cos[t + crOneOffsets[[2]]], 4.2 Sin[t + crOneOffsets[[2]]], 0.6 Sin[2 (t + crOneOffsets[[2]]) + 3 Pi/2] + 3.2}; p3 = {4.2 Cos[t + crOneOffsets[[3]] + step], 4.4 Sin[t + crOneOffsets[[3]] + step], 0.6 Sin[2 (t + crOneOffsets[[3]] + step) + 3 Pi/2] + 2.5}; p4 = {3.4 Cos[t + crOneOffsets[[4]] + random + step], 3.8 Sin[t + crOneOffsets[[4]] + random + step], 0}; pts = {p1, p2, p3, p4}; crPts = Flatten[Table[ Table[catmullRom3D[pts[[i ;; i + 3]], s], {s, 0, 1, 1/30}], {i, 1, Length[pts] - 3}], 1]; (*4. 绘制这一段的 CR 曲线+原控制点*){Thick, Opacity[0.7], Blue, Line[crPts], Transparent, PointSize[0.001], Point[pts]}, {t, crOneTs}]; crOneConnectors2 = Table[random = RandomReal[{1, 15}]*0.02; p1 = {2 Cos[t + crOneOffsets[[1]] + random], 1.5 Sin[t + crOneOffsets[[1]] + random], 0.2 Sin[2 (t + crOneOffsets[[1]] + random) + 3 Pi/2] + 3}; p2 = {4 Cos[t + crOneOffsets[[2]] + step], 4.2 Sin[t + crOneOffsets[[2]] + step], 0.6 Sin[2 (t + crOneOffsets[[2]] + step) + 3 Pi/2] + 3.2}; p3 = {4.2 Cos[t + crOneOffsets[[3]]], 4.4 Sin[t + crOneOffsets[[3]]], 0.6 Sin[2 (t + crOneOffsets[[3]]) + 3 Pi/2] + 2.5}; p4 = {3.4 Cos[t + crOneOffsets[[4]] + random - step], 3.8 Sin[t + crOneOffsets[[4]] + random - step], 0}; pts = {p1, p2, p3, p4}; crPts = Flatten[Table[ Table[catmullRom3D[pts[[i ;; i + 3]], s], {s, 0, 1, 1/30}], {i, 1, Length[pts] - 3}], 1]; (*4. 绘制这一段的 CR 曲线+原控制点*){Thick, Opacity[0.7], Blue, Line[crPts], Transparent, PointSize[0.001], Point[pts]}, {t, crOneTs}]; offset = Pi/32;crTwoOffsets = {0 + offset, Pi/16 + offset, Pi/28 + offset, -Pi/8 + offset};crTwoTs = Range[0, 2 Pi, step];crTwoConnectors = Table[random = RandomReal[{1, 15}]*0.02; p1 = {2 Cos[t + crTwoOffsets[[1]] + random], 1.5 Sin[t + crTwoOffsets[[1]] + random], 0.2 Sin[2 (t + crTwoOffsets[[1]]) + 3 Pi/2] + 3}; p2 = {4 Cos[t + crTwoOffsets[[2]]], 4.2 Sin[t + crTwoOffsets[[2]]], 0.6 Sin[2 (t + crTwoOffsets[[2]]) + 3 Pi/2] + 3.2}; p3 = {4.2 Cos[t + crTwoOffsets[[3]]], 4.4 Sin[t + crTwoOffsets[[3]]], 0.6 Sin[2 (t + crTwoOffsets[[3]]) + 3 Pi/2] + 2.5}; p4 = {3.4 Cos[t + crTwoOffsets[[4]] + random], 3.8 Sin[t + crTwoOffsets[[4]] + random], 0}; pts = {p1, p2, p3, p4}; newPts = Join[{2.1 pts[[1]] - pts[[2]]},(*p0=2*p1-p2*) pts, {2.2 pts[[-1]] - pts[[-2]]}]; crPts = Flatten[Table[ Table[catmullRom3D[newPts[[i ;; i + 3]], s], {s, 0, 1, 1/30}], {i, 1, Length[newPts] - 3}], 1]; {Thick, Opacity[0.7], Blue, Line[crPts], Transparent, PointSize[0.001], Point[pts]}, {t, crTwoTs}]; crTwoConnectors1 = Table[random = RandomReal[{1, 15}]*0.02; p1 = {2 Cos[t + crTwoOffsets[[1]] + random], 1.5 Sin[t + crTwoOffsets[[1]] + random], 0.2 Sin[2 (t + crTwoOffsets[[1]]) + 3 Pi/2] + 3}; p2 = {4 Cos[t + crTwoOffsets[[2]]], 4.2 Sin[t + crTwoOffsets[[2]]], 0.6 Sin[2 (t + crTwoOffsets[[2]]) + 3 Pi/2] + 3.2}; p3 = {4.2 Cos[t + crTwoOffsets[[3]] + step], 4.4 Sin[t + crTwoOffsets[[3]] + step], 0.6 Sin[2 (t + crTwoOffsets[[3]] + step) + 3 Pi/2] + 2.5}; p4 = {3.4 Cos[t + crTwoOffsets[[4]] + random + step], 3.8 Sin[t + crTwoOffsets[[4]] + random + step], 0}; pts = {p1, p2, p3, p4}; crPts = Flatten[Table[ Table[catmullRom3D[pts[[i ;; i + 3]], s], {s, 0, 1, 1/30}], {i, 1, Length[pts] - 3}], 1]; {Thick, Opacity[0.7], Blue, Line[crPts], Transparent, PointSize[0.001], Point[pts]}, {t, crTwoTs}]; crTwoConnectors2 = Table[random = RandomReal[{1, 15}]*0.02; p1 = {2 Cos[t + crTwoOffsets[[1]] + random], 1.5 Sin[t + crTwoOffsets[[1]] + random], 0.2 Sin[2 (t + crTwoOffsets[[1]]) + 3 Pi/2] + 3}; p2 = {4 Cos[t + crTwoOffsets[[2]] + step], 4.2 Sin[t + crTwoOffsets[[2]] + step], 0.6 Sin[2 (t + crTwoOffsets[[2]] + step) + 3 Pi/2] + 3.2}; p3 = {4.2 Cos[t + crTwoOffsets[[3]]], 4.4 Sin[t + crTwoOffsets[[3]]], 0.6 Sin[2 (t + crTwoOffsets[[3]]) + 3 Pi/2] + 2.5}; p4 = {3.4 Cos[t + crTwoOffsets[[4]] + random - step], 3.8 Sin[t + crTwoOffsets[[4]] + random - step], 0}; pts = {p1, p2, p3, p4}; crPts = Flatten[Table[ Table[catmullRom3D[pts[[i ;; i + 3]], s], {s, 0, 1, 1/30}], {i, 1, Length[pts] - 3}], 1]; {Thick, Opacity[0.7], Blue, Line[crPts], Transparent, PointSize[0.001], Point[pts]}, {t, crTwoTs}]; png = Show[Graphics3D[crOneConnectors], Graphics3D[crOneConnectors1], Graphics3D[crOneConnectors2], Graphics3D[crTwoConnectors], Graphics3D[crTwoConnectors1], Graphics3D[crTwoConnectors2], curve12, curve21, curve22, curve31, axes, Axes -> True, AxesLabel -> {"X", "Y", "Z"}, PlotRange -> {{-5, 5}, {-5, 5}, {-5, 5}}, BoxRatios -> {1, 1, 1}, ImageSize -> Large, PlotLabel -> "Bird's Nest"]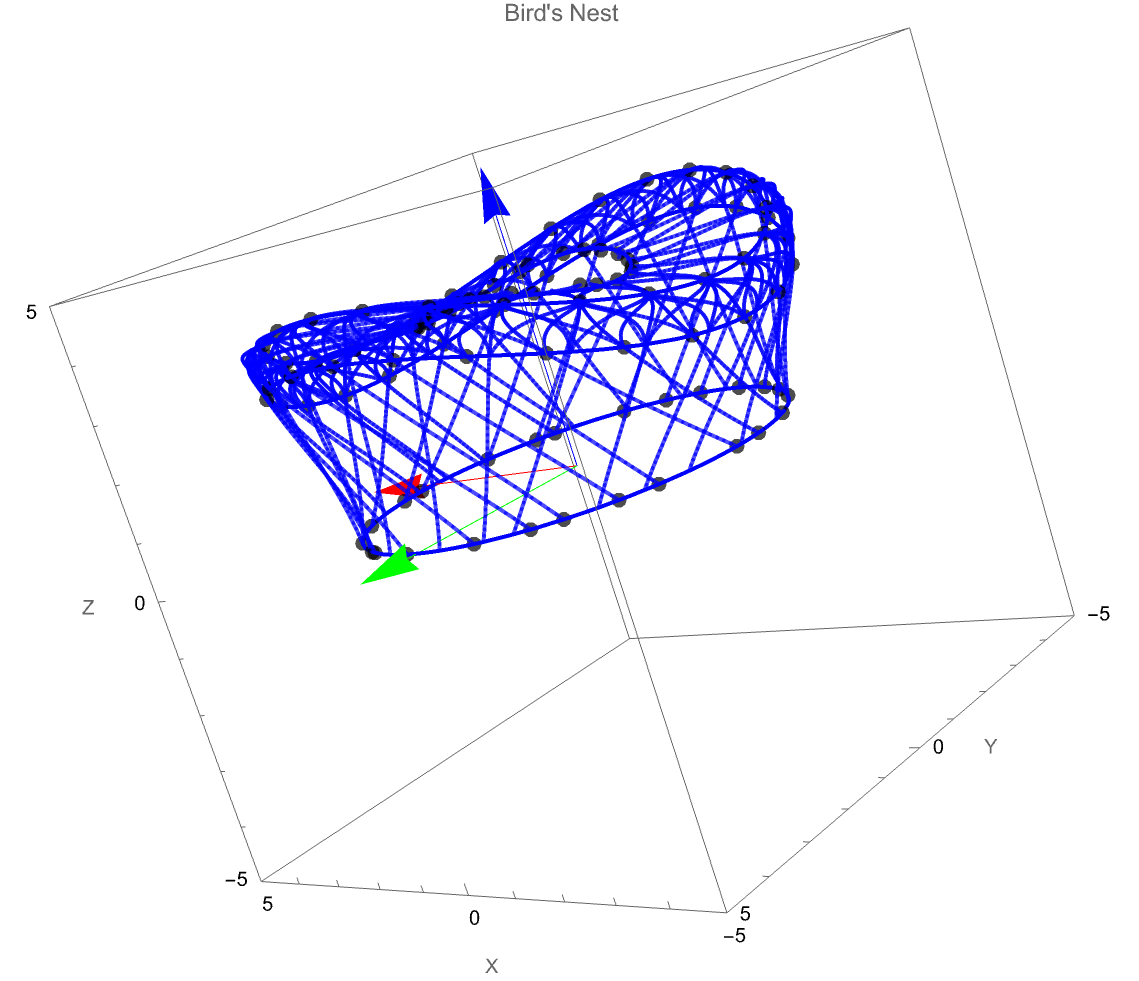
mathematica 调整下图形
curve12 = ParametricPlot3D[{2 Cos[t], 1.5 Sin[t], 0.2 Sin[2 t + Pi + Pi/2] + 3}, {t, 0, 2 Pi}, PlotStyle -> {Thickness[0.002], Blue}, PlotRange -> {{-5, 5}, {-5, 5}, {-5, 5}}, BoxRatios -> {1, 1, 1}];curve21 = ParametricPlot3D[{4 Cos[t], 4.2 Sin[t], 0.6 Sin[2 t + Pi + Pi/2] + 3.2}, {t, 0, 2 Pi}, PlotStyle -> {Thickness[0.002], Blue}, PlotRange -> {{-5, 5}, {-5, 5}, {-5, 5}}, BoxRatios -> {1, 1, 1}];curve22 = ParametricPlot3D[{4.2 Cos[t], 4.4 Sin[t], 0.6 Sin[2 t + Pi + Pi/2] + 2.5}, {t, 0, 2 Pi}, PlotStyle -> {Thickness[0.002], Blue}, PlotRange -> {{-5, 5}, {-5, 5}, {-5, 5}}, BoxRatios -> {1, 1, 1}];curve31 = ParametricPlot3D[{3.4 Cos[t], 3.8 Sin[t], 0}, {t, 0, 2 \[Pi]}, PlotStyle -> {Thickness[0.002], Blue}, Axes -> False, PlotRange -> {{-5, 5}, {-5, 5}, {-5, 5}}, BoxRatios -> {1, 1, 1}]; axes = Graphics3D[{Arrowheads[0.05], {Red, Arrow[{{0, 0, 0}, {5, 0, 0}}]},(*X 轴*){Green, Arrow[{{0, 0, 0}, {0, 5, 0}}]},(*Y 轴*){Blue, Arrow[{{0, 0, 0}, {0, 0, 5}}]} (*Z 轴*)}]; catmullRom3D[{p0_, p1_, p2_, p3_}, t_] := 0.5*{2 p1[[1]] + t (p2[[1]] - p0[[1]]) + t^2 (2 p0[[1]] - 5 p1[[1]] + 4 p2[[1]] - p3[[1]]) + t^3 (-p0[[1]] + 3 p1[[1]] - 3 p2[[1]] + p3[[1]]), 2 p1[[2]] + t (p2[[2]] - p0[[2]]) + t^2 (2 p0[[2]] - 5 p1[[2]] + 4 p2[[2]] - p3[[2]]) + t^3 (-p0[[2]] + 3 p1[[2]] - 3 p2[[2]] + p3[[2]]), 2 p1[[3]] + t (p2[[3]] - p0[[3]]) + t^2 (2 p0[[3]] - 5 p1[[3]] + 4 p2[[3]] - p3[[3]]) + t^3 (-p0[[3]] + 3 p1[[3]] - 3 p2[[3]] + p3[[3]])}; offset = 0;step = 0.25crOneOffsets = {0 + offset, -Pi/16 + offset, -Pi/28 + offset, Pi/8 + offset};crOneTs = Range[0, 2 Pi - step, step]; (*curve31 上的点*)crOneConnectors = Table[random = RandomReal[{1, 15}]*0.02; p1 = {2 Cos[t + crOneOffsets[[1]] + random], 1.5 Sin[t + crOneOffsets[[1]] + random], 0.2 Sin[2 (t + crOneOffsets[[1]]) + 3 Pi/2] + 3}; p2 = {4 Cos[t + crOneOffsets[[2]]], 4.2 Sin[t + crOneOffsets[[2]]], 0.6 Sin[2 (t + crOneOffsets[[2]]) + 3 Pi/2] + 3.2}; p3 = {4.2 Cos[t + crOneOffsets[[3]]], 4.4 Sin[t + crOneOffsets[[3]]], 0.6 Sin[2 (t + crOneOffsets[[3]]) + 3 Pi/2] + 2.5}; p4 = {3.4 Cos[t + crOneOffsets[[4]] + random], 3.8 Sin[t + crOneOffsets[[4]] + random], 0}; pts = {p1, p2, p3, p4}; newPts = Join[{2.1 pts[[1]] - pts[[2]]}, pts, {2.2 pts[[-1]] - pts[[-2]]}]; crPts = Flatten[Table[ Table[catmullRom3D[newPts[[i ;; i + 3]], s], {s, 0, 1, 1/30}], {i, 1, Length[newPts] - 3}], 1]; (*4. 绘制这一段的 CR 曲线+原控制点*){Thickness[0.002], Opacity[0.7], Blue, Line[crPts], Transparent, PointSize[0.015], Point[pts]}, {t, crOneTs}]; crOneConnectors1 = Table[random = RandomReal[{1, 15}]*0.02; p1 = {2 Cos[t + crOneOffsets[[1]] + random], 1.5 Sin[t + crOneOffsets[[1]] + random], 0.2 Sin[2 (t + crOneOffsets[[1]] + random) + 3 Pi/2] + 3}; p2 = {4 Cos[t + crOneOffsets[[2]]], 4.2 Sin[t + crOneOffsets[[2]]], 0.6 Sin[2 (t + crOneOffsets[[2]]) + 3 Pi/2] + 3.2}; p3 = {4.2 Cos[t + crOneOffsets[[3]] + step], 4.4 Sin[t + crOneOffsets[[3]] + step], 0.6 Sin[2 (t + crOneOffsets[[3]] + step) + 3 Pi/2] + 2.5}; p4 = {3.4 Cos[t + crOneOffsets[[4]] + random + step], 3.8 Sin[t + crOneOffsets[[4]] + random + step], 0}; pts = {p1, p2, p3, p4}; crPts = Flatten[Table[ Table[catmullRom3D[pts[[i ;; i + 3]], s], {s, 0, 1, 1/30}], {i, 1, Length[pts] - 3}], 1]; (*4. 绘制这一段的 CR 曲线+原控制点*){Thickness[0.002], Opacity[0.7], Blue, Line[crPts], Transparent, PointSize[0.001], Point[pts]}, {t, crOneTs}]; crOneConnectors2 = Table[random = RandomReal[{1, 15}]*0.02; p1 = {2 Cos[t + crOneOffsets[[1]] + random], 1.5 Sin[t + crOneOffsets[[1]] + random], 0.2 Sin[2 (t + crOneOffsets[[1]] + random) + 3 Pi/2] + 3}; p2 = {4 Cos[t + crOneOffsets[[2]] + step], 4.2 Sin[t + crOneOffsets[[2]] + step], 0.6 Sin[2 (t + crOneOffsets[[2]] + step) + 3 Pi/2] + 3.2}; p3 = {4.2 Cos[t + crOneOffsets[[3]]], 4.4 Sin[t + crOneOffsets[[3]]], 0.6 Sin[2 (t + crOneOffsets[[3]]) + 3 Pi/2] + 2.5}; p4 = {3.4 Cos[t + crOneOffsets[[4]] + random - step], 3.8 Sin[t + crOneOffsets[[4]] + random - step], 0}; pts = {p1, p2, p3, p4}; crPts = Flatten[Table[ Table[catmullRom3D[pts[[i ;; i + 3]], s], {s, 0, 1, 1/30}], {i, 1, Length[pts] - 3}], 1]; (*4. 绘制这一段的 CR 曲线+原控制点*){Thickness[0.002], Opacity[0.7], Blue, Line[crPts], Transparent, PointSize[0.001], Point[pts]}, {t, crOneTs}]; offset = Pi/32;crTwoOffsets = {0 + offset, Pi/16 + offset, Pi/28 + offset, -Pi/8 + offset};crTwoTs = Range[0, 2 Pi, step];crTwoConnectors = Table[random = RandomReal[{1, 15}]*0.02; p1 = {2 Cos[t + crTwoOffsets[[1]] + random], 1.5 Sin[t + crTwoOffsets[[1]] + random], 0.2 Sin[2 (t + crTwoOffsets[[1]]) + 3 Pi/2] + 3}; p2 = {4 Cos[t + crTwoOffsets[[2]]], 4.2 Sin[t + crTwoOffsets[[2]]], 0.6 Sin[2 (t + crTwoOffsets[[2]]) + 3 Pi/2] + 3.2}; p3 = {4.2 Cos[t + crTwoOffsets[[3]]], 4.4 Sin[t + crTwoOffsets[[3]]], 0.6 Sin[2 (t + crTwoOffsets[[3]]) + 3 Pi/2] + 2.5}; p4 = {3.4 Cos[t + crTwoOffsets[[4]] + random], 3.8 Sin[t + crTwoOffsets[[4]] + random], 0}; pts = {p1, p2, p3, p4}; newPts = Join[{2.1 pts[[1]] - pts[[2]]},(*p0=2*p1-p2*) pts, {2.2 pts[[-1]] - pts[[-2]]}]; crPts = Flatten[Table[ Table[catmullRom3D[newPts[[i ;; i + 3]], s], {s, 0, 1, 1/30}], {i, 1, Length[newPts] - 3}], 1]; {Thickness[0.002], Opacity[0.7], Blue, Line[crPts], Transparent, PointSize[0.001], Point[pts]}, {t, crTwoTs}]; crTwoConnectors1 = Table[random = RandomReal[{1, 15}]*0.02; p1 = {2 Cos[t + crTwoOffsets[[1]] + random], 1.5 Sin[t + crTwoOffsets[[1]] + random], 0.2 Sin[2 (t + crTwoOffsets[[1]]) + 3 Pi/2] + 3}; p2 = {4 Cos[t + crTwoOffsets[[2]]], 4.2 Sin[t + crTwoOffsets[[2]]], 0.6 Sin[2 (t + crTwoOffsets[[2]]) + 3 Pi/2] + 3.2}; p3 = {4.2 Cos[t + crTwoOffsets[[3]] + step], 4.4 Sin[t + crTwoOffsets[[3]] + step], 0.6 Sin[2 (t + crTwoOffsets[[3]] + step) + 3 Pi/2] + 2.5}; p4 = {3.4 Cos[t + crTwoOffsets[[4]] + random + step], 3.8 Sin[t + crTwoOffsets[[4]] + random + step], 0}; pts = {p1, p2, p3, p4}; crPts = Flatten[Table[ Table[catmullRom3D[pts[[i ;; i + 3]], s], {s, 0, 1, 1/30}], {i, 1, Length[pts] - 3}], 1]; {Thickness[0.002], Opacity[0.7], Blue, Line[crPts], Transparent, PointSize[0.001], Point[pts]}, {t, crTwoTs}]; crTwoConnectors2 = Table[random = RandomReal[{1, 15}]*0.02; p1 = {2 Cos[t + crTwoOffsets[[1]] + random], 1.5 Sin[t + crTwoOffsets[[1]] + random], 0.2 Sin[2 (t + crTwoOffsets[[1]]) + 3 Pi/2] + 3}; p2 = {4 Cos[t + crTwoOffsets[[2]] + step], 4.2 Sin[t + crTwoOffsets[[2]] + step], 0.6 Sin[2 (t + crTwoOffsets[[2]] + step) + 3 Pi/2] + 3.2}; p3 = {4.2 Cos[t + crTwoOffsets[[3]]], 4.4 Sin[t + crTwoOffsets[[3]]], 0.6 Sin[2 (t + crTwoOffsets[[3]]) + 3 Pi/2] + 2.5}; p4 = {3.4 Cos[t + crTwoOffsets[[4]] + random - step], 3.8 Sin[t + crTwoOffsets[[4]] + random - step], 0}; pts = {p1, p2, p3, p4}; crPts = Flatten[Table[ Table[catmullRom3D[pts[[i ;; i + 3]], s], {s, 0, 1, 1/30}], {i, 1, Length[pts] - 3}], 1]; {Thickness[0.002], Opacity[0.7], Blue, Line[crPts], Transparent, PointSize[0.001], Point[pts]}, {t, crTwoTs}]; png = Show[Graphics3D[crOneConnectors], Graphics3D[crOneConnectors1], Graphics3D[crOneConnectors2], Graphics3D[crTwoConnectors], Graphics3D[crTwoConnectors1], Graphics3D[crTwoConnectors2], curve12,(*curve21,curve22,*)curve31, axes, Axes -> True, AxesLabel -> {"X", "Y", "Z"}, PlotRange -> {{-5, 5}, {-5, 5}, {-5, 5}}, BoxRatios -> {1, 1, 1}, ImageSize -> Large, PlotLabel -> "Bird's Nest"]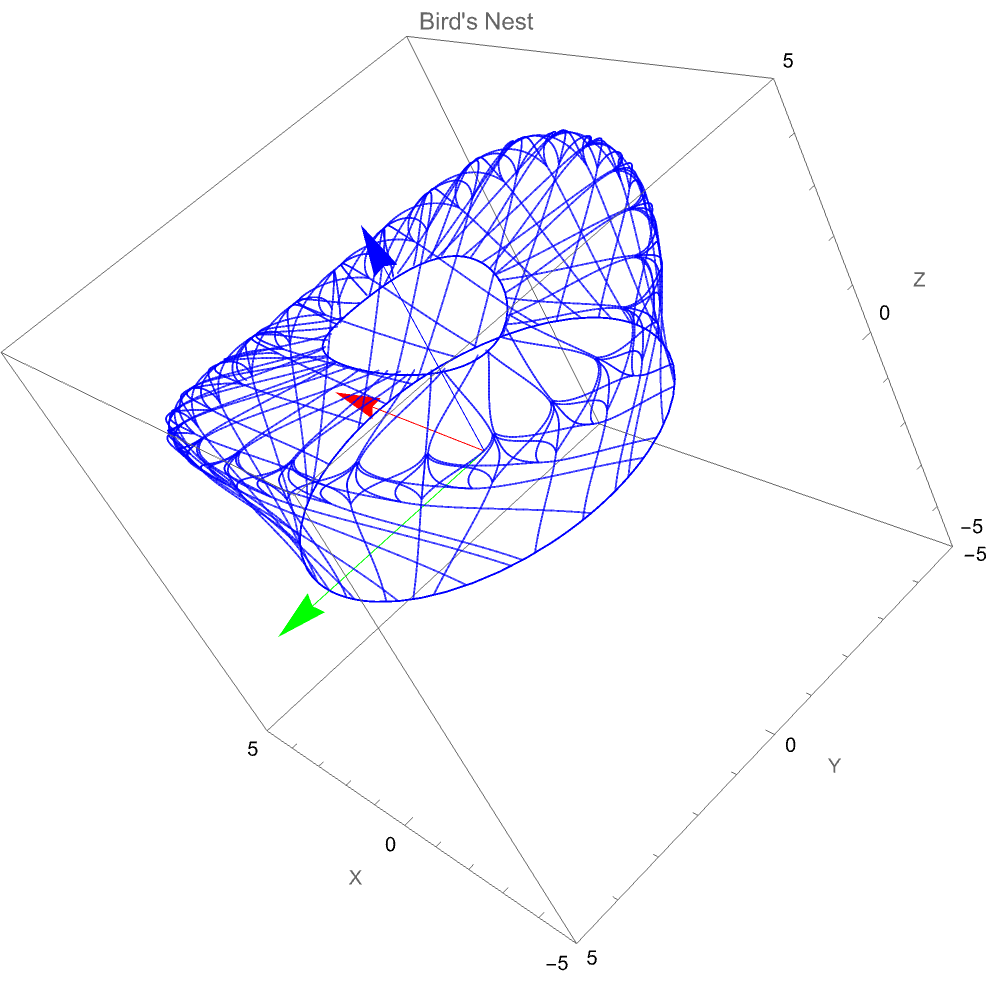
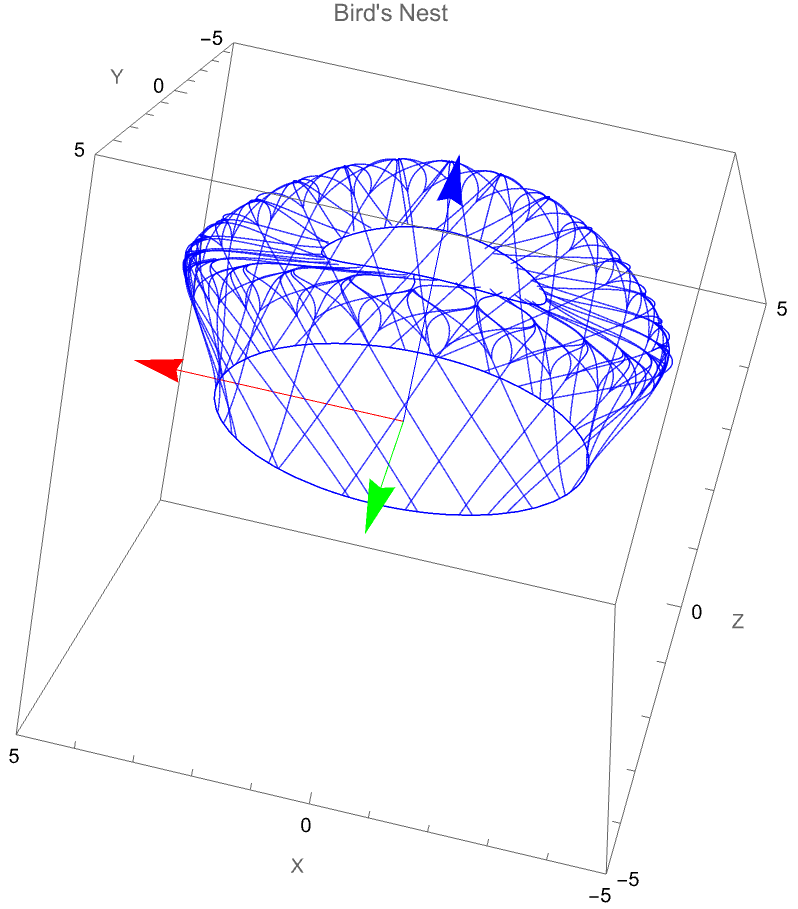
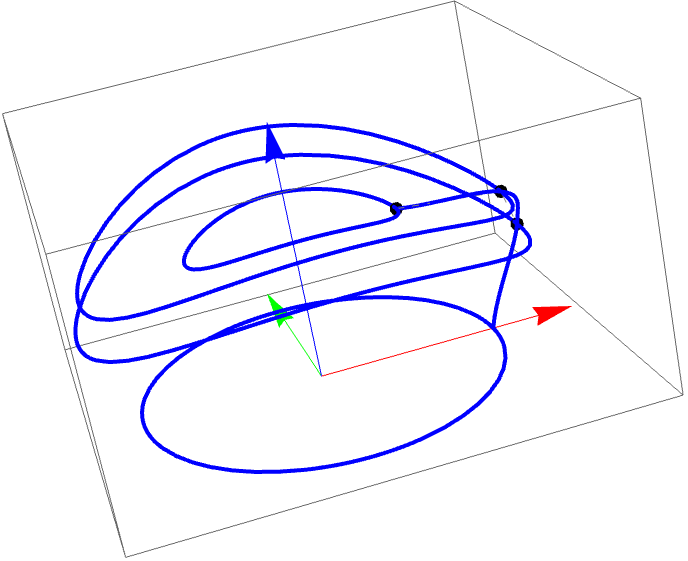
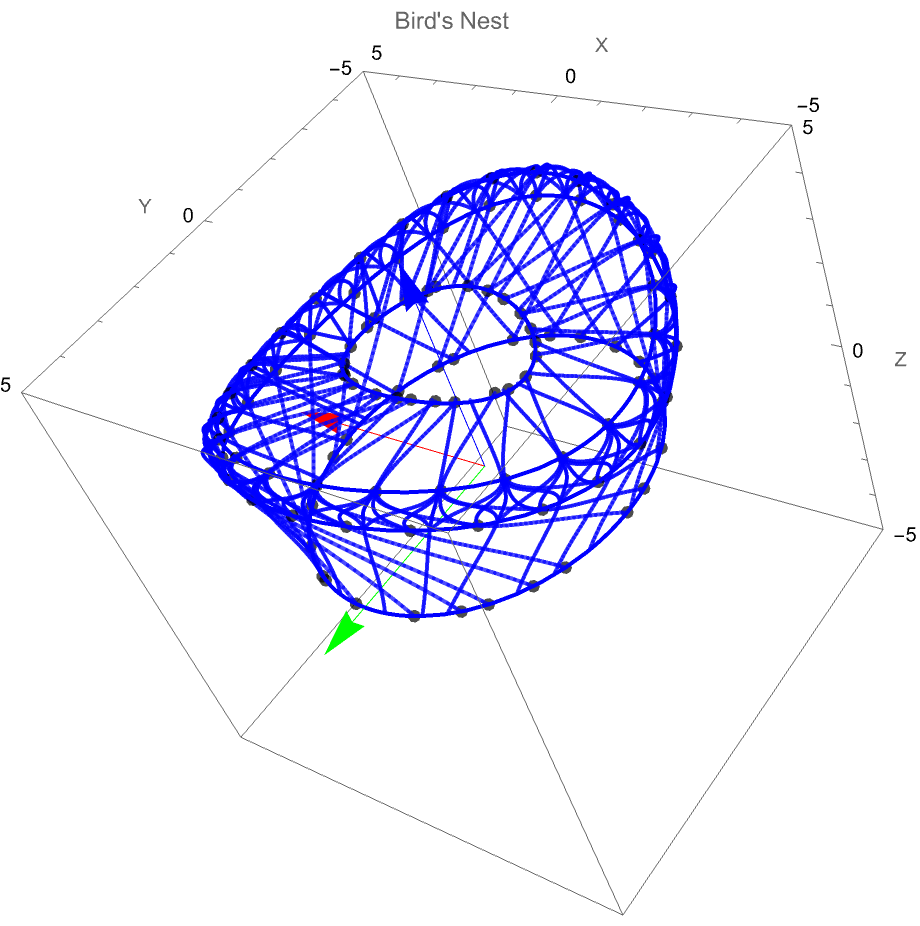
mathematica 随机添加一些横线
curve12 = ParametricPlot3D[{2 Cos[t], 1.5 Sin[t], 0.2 Sin[2 t + Pi + Pi/2] + 3}, {t, 0, 2 Pi}, PlotStyle -> {Thickness[0.002], Blue}, PlotRange -> {{-5, 5}, {-5, 5}, {-5, 5}}, BoxRatios -> {1, 1, 1}];curve21 = ParametricPlot3D[{4 Cos[t], 4.2 Sin[t], 0.6 Sin[2 t + Pi + Pi/2] + 3.2}, {t, 0, 2 Pi}, PlotStyle -> {Thickness[0.002], Blue}, PlotRange -> {{-5, 5}, {-5, 5}, {-5, 5}}, BoxRatios -> {1, 1, 1}];curve22 = ParametricPlot3D[{4.2 Cos[t], 4.4 Sin[t], 0.6 Sin[2 t + Pi + Pi/2] + 2.5}, {t, 0, 2 Pi}, PlotStyle -> {Thickness[0.002], Blue}, PlotRange -> {{-5, 5}, {-5, 5}, {-5, 5}}, BoxRatios -> {1, 1, 1}];curve31 = ParametricPlot3D[{3.4 Cos[t], 3.8 Sin[t], 0}, {t, 0, 2 \[Pi]}, PlotStyle -> {Thickness[0.002], Blue}, Axes -> False, PlotRange -> {{-5, 5}, {-5, 5}, {-5, 5}}, BoxRatios -> {1, 1, 1}]; axes = Graphics3D[{Arrowheads[0.05], {Red, Arrow[{{0, 0, 0}, {5, 0, 0}}]},(*X 轴*){Green, Arrow[{{0, 0, 0}, {0, 5, 0}}]},(*Y 轴*){Blue, Arrow[{{0, 0, 0}, {0, 0, 5}}]} (*Z 轴*)}]; catmullRom3D[{p0_, p1_, p2_, p3_}, t_] := 0.5*{2 p1[[1]] + t (p2[[1]] - p0[[1]]) + t^2 (2 p0[[1]] - 5 p1[[1]] + 4 p2[[1]] - p3[[1]]) + t^3 (-p0[[1]] + 3 p1[[1]] - 3 p2[[1]] + p3[[1]]), 2 p1[[2]] + t (p2[[2]] - p0[[2]]) + t^2 (2 p0[[2]] - 5 p1[[2]] + 4 p2[[2]] - p3[[2]]) + t^3 (-p0[[2]] + 3 p1[[2]] - 3 p2[[2]] + p3[[2]]), 2 p1[[3]] + t (p2[[3]] - p0[[3]]) + t^2 (2 p0[[3]] - 5 p1[[3]] + 4 p2[[3]] - p3[[3]]) + t^3 (-p0[[3]] + 3 p1[[3]] - 3 p2[[3]] + p3[[3]])}; p1Collection = {};p2Collection = {};p3Collection = {};p4Collection = {}; offset = 0;step = 0.25crOneOffsets = {0 + offset, -Pi/16 + offset, -Pi/28 + offset, Pi/8 + offset};crOneTs = Range[0, 2 Pi - step, step]; (*curve31 上的点*)crOneConnectors = Table[random = RandomReal[{1, 15}]*0.02; p1 = {2 Cos[t + crOneOffsets[[1]] + random], 1.5 Sin[t + crOneOffsets[[1]] + random], 0.2 Sin[2 (t + crOneOffsets[[1]]) + 3 Pi/2] + 3}; p2 = {4 Cos[t + crOneOffsets[[2]]], 4.2 Sin[t + crOneOffsets[[2]]], 0.6 Sin[2 (t + crOneOffsets[[2]]) + 3 Pi/2] + 3.2}; p3 = {4.2 Cos[t + crOneOffsets[[3]]], 4.4 Sin[t + crOneOffsets[[3]]], 0.6 Sin[2 (t + crOneOffsets[[3]]) + 3 Pi/2] + 2.5}; p4 = {3.4 Cos[t + crOneOffsets[[4]] + random], 3.8 Sin[t + crOneOffsets[[4]] + random], 0}; AppendTo[p1Collection, p1]; AppendTo[p2Collection, p2]; AppendTo[p3Collection, p3]; AppendTo[p4Collection, p4]; pts = {p1, p2, p3, p4}; newPts = Join[{2.1 pts[[1]] - pts[[2]]}, pts, {2.2 pts[[-1]] - pts[[-2]]}]; crPts = Flatten[Table[ Table[catmullRom3D[newPts[[i ;; i + 3]], s], {s, 0, 1, 1/30}], {i, 1, Length[newPts] - 3}], 1]; (*4. 绘制这一段的 CR 曲线+原控制点*){Thickness[0.002], Opacity[0.7], Blue, Line[crPts], Transparent, PointSize[0.015], Point[pts]}, {t, crOneTs}]; crOneConnectors1 = Table[random = RandomReal[{1, 15}]*0.02; p1 = {2 Cos[t + crOneOffsets[[1]] + random], 1.5 Sin[t + crOneOffsets[[1]] + random], 0.2 Sin[2 (t + crOneOffsets[[1]] + random) + 3 Pi/2] + 3}; p2 = {4 Cos[t + crOneOffsets[[2]]], 4.2 Sin[t + crOneOffsets[[2]]], 0.6 Sin[2 (t + crOneOffsets[[2]]) + 3 Pi/2] + 3.2}; p3 = {4.2 Cos[t + crOneOffsets[[3]] + step], 4.4 Sin[t + crOneOffsets[[3]] + step], 0.6 Sin[2 (t + crOneOffsets[[3]] + step) + 3 Pi/2] + 2.5}; p4 = {3.4 Cos[t + crOneOffsets[[4]] + random + step], 3.8 Sin[t + crOneOffsets[[4]] + random + step], 0}; pts = {p1, p2, p3, p4}; crPts = Flatten[Table[ Table[catmullRom3D[pts[[i ;; i + 3]], s], {s, 0, 1, 1/30}], {i, 1, Length[pts] - 3}], 1]; (*4. 绘制这一段的 CR 曲线+原控制点*){Thickness[0.002], Opacity[0.7], Blue, Line[crPts], Transparent, PointSize[0.001], Point[pts]}, {t, crOneTs}]; crOneConnectors2 = Table[random = RandomReal[{1, 15}]*0.02; p1 = {2 Cos[t + crOneOffsets[[1]] + random], 1.5 Sin[t + crOneOffsets[[1]] + random], 0.2 Sin[2 (t + crOneOffsets[[1]] + random) + 3 Pi/2] + 3}; p2 = {4 Cos[t + crOneOffsets[[2]] + step], 4.2 Sin[t + crOneOffsets[[2]] + step], 0.6 Sin[2 (t + crOneOffsets[[2]] + step) + 3 Pi/2] + 3.2}; p3 = {4.2 Cos[t + crOneOffsets[[3]]], 4.4 Sin[t + crOneOffsets[[3]]], 0.6 Sin[2 (t + crOneOffsets[[3]]) + 3 Pi/2] + 2.5}; p4 = {3.4 Cos[t + crOneOffsets[[4]] + random - step], 3.8 Sin[t + crOneOffsets[[4]] + random - step], 0}; pts = {p1, p2, p3, p4}; crPts = Flatten[Table[ Table[catmullRom3D[pts[[i ;; i + 3]], s], {s, 0, 1, 1/30}], {i, 1, Length[pts] - 3}], 1]; (*4. 绘制这一段的 CR 曲线+原控制点*){Thickness[0.002], Opacity[0.7], Blue, Line[crPts], Transparent, PointSize[0.001], Point[pts]}, {t, crOneTs}]; (*生成30条随机连接线,确保位置差不超过30*)crOneRandomP1P2Lines = Table[(*随机选择p1集合中的索引*) idx1 = RandomInteger[{1, Length[p1Collection]}]; (*计算p2集合中的有效索引范围*)minIdx2 = Max[1, idx1 - 1]; maxIdx2 = Min[Length[p2Collection], idx1 + 6]; (*在有效范围内随机选择p2索引*)idx2 = RandomInteger[{minIdx2, maxIdx2}]; (*获取点*)randomP1 = p1Collection[[idx1]]; randomP2 = p2Collection[[idx2]]; (*计算位置差*)posDiff = Abs[idx1 - idx2]; (*创建颜色-位置差越小越蓝,越大越红*)hueValue = Rescale[posDiff, {0, 10}, {0.6, 0}]; (*lineColor=Hue[hueValue];*)lineColor = Blue; (*绘制线段和端点*){Thickness[0.002], Opacity[0.7], lineColor, Line[{randomP1, randomP2}]}, {30}]; (*循环30次*) crOneRandomP2Lines = Table[(*随机选择p1集合中的索引*) idx1 = RandomInteger[{1, Length[p2Collection]}]; (*计算p2集合中的有效索引范围*)minIdx2 = Max[1, idx1 - 1]; maxIdx2 = Min[Length[p2Collection], idx1 + 6]; (*在有效范围内随机选择p2索引*)idx2 = RandomInteger[{minIdx2, maxIdx2}]; (*获取点*)randomP1 = p2Collection[[idx1]]; randomP2 = p2Collection[[idx2]]; (*计算位置差*)posDiff = Abs[idx1 - idx2]; (*创建颜色-位置差越小越蓝,越大越红*)hueValue = Rescale[posDiff, {0, 10}, {0.6, 0}]; lineColor = Blue; (*绘制线段和端点*){Thickness[0.002], Opacity[0.7], lineColor, Line[{randomP1, randomP2}]}, {30}]; (*循环30次*) crOneRandomP3P4Lines = Table[(*随机选择p1集合中的索引*) idx1 = RandomInteger[{1, Length[p3Collection]}]; (*计算p2集合中的有效索引范围*)minIdx2 = Max[1, idx1 - 8]; maxIdx2 = Min[Length[p4Collection], idx1]; (*在有效范围内随机选择p2索引*)idx2 = RandomInteger[{minIdx2, maxIdx2}]; (*获取点*)randomP1 = p3Collection[[idx1]]; randomP2 = p4Collection[[idx2]]; (*计算位置差*)posDiff = Abs[idx1 - idx2]; (*创建颜色-位置差越小越蓝,越大越红*)hueValue = Rescale[posDiff, {0, 10}, {0.6, 0}]; lineColor = Blue; (*绘制线段和端点*){Thickness[0.002], Opacity[0.7], lineColor, Line[{randomP1, randomP2}]}, {30}]; (*循环30次*) p1Collection = {};p2Collection = {};p3Collection = {};p4Collection = {};offset = Pi/32;crTwoOffsets = {0 + offset, Pi/16 + offset, Pi/28 + offset, -Pi/8 + offset};crTwoTs = Range[0, 2 Pi, step];crTwoConnectors = Table[random = RandomReal[{1, 15}]*0.02; p1 = {2 Cos[t + crTwoOffsets[[1]] + random], 1.5 Sin[t + crTwoOffsets[[1]] + random], 0.2 Sin[2 (t + crTwoOffsets[[1]]) + 3 Pi/2] + 3}; p2 = {4 Cos[t + crTwoOffsets[[2]]], 4.2 Sin[t + crTwoOffsets[[2]]], 0.6 Sin[2 (t + crTwoOffsets[[2]]) + 3 Pi/2] + 3.2}; p3 = {4.2 Cos[t + crTwoOffsets[[3]]], 4.4 Sin[t + crTwoOffsets[[3]]], 0.6 Sin[2 (t + crTwoOffsets[[3]]) + 3 Pi/2] + 2.5}; p4 = {3.4 Cos[t + crTwoOffsets[[4]] + random], 3.8 Sin[t + crTwoOffsets[[4]] + random], 0}; AppendTo[p1Collection, p1]; AppendTo[p2Collection, p2]; AppendTo[p3Collection, p3]; AppendTo[p4Collection, p4]; pts = {p1, p2, p3, p4}; newPts = Join[{2.1 pts[[1]] - pts[[2]]},(*p0=2*p1-p2*) pts, {2.2 pts[[-1]] - pts[[-2]]}]; crPts = Flatten[Table[ Table[catmullRom3D[newPts[[i ;; i + 3]], s], {s, 0, 1, 1/30}], {i, 1, Length[newPts] - 3}], 1]; {Thickness[0.002], Opacity[0.7], Blue, Line[crPts], Transparent, PointSize[0.001], Point[pts]}, {t, crTwoTs}]; crTwoConnectors1 = Table[random = RandomReal[{1, 15}]*0.02; p1 = {2 Cos[t + crTwoOffsets[[1]] + random], 1.5 Sin[t + crTwoOffsets[[1]] + random], 0.2 Sin[2 (t + crTwoOffsets[[1]]) + 3 Pi/2] + 3}; p2 = {4 Cos[t + crTwoOffsets[[2]]], 4.2 Sin[t + crTwoOffsets[[2]]], 0.6 Sin[2 (t + crTwoOffsets[[2]]) + 3 Pi/2] + 3.2}; p3 = {4.2 Cos[t + crTwoOffsets[[3]] + step], 4.4 Sin[t + crTwoOffsets[[3]] + step], 0.6 Sin[2 (t + crTwoOffsets[[3]] + step) + 3 Pi/2] + 2.5}; p4 = {3.4 Cos[t + crTwoOffsets[[4]] + random + step], 3.8 Sin[t + crTwoOffsets[[4]] + random + step], 0}; pts = {p1, p2, p3, p4}; crPts = Flatten[Table[ Table[catmullRom3D[pts[[i ;; i + 3]], s], {s, 0, 1, 1/30}], {i, 1, Length[pts] - 3}], 1]; {Thickness[0.002], Opacity[0.7], Blue, Line[crPts], Transparent, PointSize[0.001], Point[pts]}, {t, crTwoTs}]; crTwoConnectors2 = Table[random = RandomReal[{1, 15}]*0.02; p1 = {2 Cos[t + crTwoOffsets[[1]] + random], 1.5 Sin[t + crTwoOffsets[[1]] + random], 0.2 Sin[2 (t + crTwoOffsets[[1]]) + 3 Pi/2] + 3}; p2 = {4 Cos[t + crTwoOffsets[[2]] + step], 4.2 Sin[t + crTwoOffsets[[2]] + step], 0.6 Sin[2 (t + crTwoOffsets[[2]] + step) + 3 Pi/2] + 3.2}; p3 = {4.2 Cos[t + crTwoOffsets[[3]]], 4.4 Sin[t + crTwoOffsets[[3]]], 0.6 Sin[2 (t + crTwoOffsets[[3]]) + 3 Pi/2] + 2.5}; p4 = {3.4 Cos[t + crTwoOffsets[[4]] + random - step], 3.8 Sin[t + crTwoOffsets[[4]] + random - step], 0}; pts = {p1, p2, p3, p4}; crPts = Flatten[Table[ Table[catmullRom3D[pts[[i ;; i + 3]], s], {s, 0, 1, 1/30}], {i, 1, Length[pts] - 3}], 1]; {Thickness[0.002], Opacity[0.7], Blue, Line[crPts], Transparent, PointSize[0.001], Point[pts]}, {t, crTwoTs}]; (*生成30条随机连接线,确保位置差不超过30*)crTwoRandomP1P2Lines = Table[(*随机选择p1集合中的索引*) idx1 = RandomInteger[{1, Length[p1Collection]}]; (*计算p2集合中的有效索引范围*)minIdx2 = Max[1, idx1 - 6]; maxIdx2 = Min[Length[p2Collection], idx1 + 1]; (*在有效范围内随机选择p2索引*)idx2 = RandomInteger[{minIdx2, maxIdx2}]; (*获取点*)randomP1 = p1Collection[[idx1]]; randomP2 = p2Collection[[idx2]]; (*计算位置差*)posDiff = Abs[idx1 - idx2]; (*创建颜色-位置差越小越蓝,越大越红*)hueValue = Rescale[posDiff, {0, 10}, {0.6, 0}]; lineColor = Blue; (*绘制线段和端点*){Thickness[0.002], Opacity[0.7], lineColor, Line[{randomP1, randomP2}]}, {30}]; (*循环30次*) crTwoRandomP2Lines = Table[(*随机选择p1集合中的索引*) idx1 = RandomInteger[{1, Length[p2Collection]}]; (*计算p2集合中的有效索引范围*)minIdx2 = Max[1, idx1 - 6]; maxIdx2 = Min[Length[p2Collection], idx1 + 1]; (*在有效范围内随机选择p2索引*)idx2 = RandomInteger[{minIdx2, maxIdx2}]; (*获取点*)randomP1 = p2Collection[[idx1]]; randomP2 = p2Collection[[idx2]]; (*计算位置差*)posDiff = Abs[idx1 - idx2]; (*创建颜色-位置差越小越蓝,越大越红*)hueValue = Rescale[posDiff, {0, 10}, {0.6, 0}]; lineColor = Blue; (*绘制线段和端点*){Thickness[0.002], Opacity[0.7], lineColor, Line[{randomP1, randomP2}]}, {30}]; (*循环30次*) crTwoRandomP3P4Lines = Table[(*随机选择p1集合中的索引*) idx1 = RandomInteger[{1, Length[p3Collection]}]; (*计算p2集合中的有效索引范围*)minIdx2 = Max[1, idx1]; maxIdx2 = Min[Length[p4Collection], idx1 + 8]; (*在有效范围内随机选择p2索引*)idx2 = RandomInteger[{minIdx2, maxIdx2}]; (*获取点*)randomP1 = p3Collection[[idx1]]; randomP2 = p4Collection[[idx2]]; (*计算位置差*)posDiff = Abs[idx1 - idx2]; (*创建颜色-位置差越小越蓝,越大越红*)hueValue = Rescale[posDiff, {0, 10}, {0.6, 0}]; lineColor = Blue; (*绘制线段和端点*){Thickness[0.002], Opacity[0.7], lineColor, Line[{randomP1, randomP2}]}, {30}]; (*循环30次*) png = Show[Graphics3D[crOneConnectors], Graphics3D[crOneConnectors1], Graphics3D[crOneConnectors2], Graphics3D[crTwoConnectors], Graphics3D[crTwoConnectors1], Graphics3D[crTwoConnectors2], Graphics3D[crOneRandomP1P2Lines], Graphics3D[crOneRandomP2Lines], Graphics3D[crOneRandomP3P4Lines], Graphics3D[crTwoRandomP1P2Lines], Graphics3D[crTwoRandomP2Lines], Graphics3D[crTwoRandomP3P4Lines], curve12,(*curve21,curve22,*)curve31, axes, Axes -> True, AxesLabel -> {"X", "Y", "Z"}, PlotRange -> {{-5, 5}, {-5, 5}, {-5, 5}}, BoxRatios -> {1, 1, 1}, ImageSize -> Large, PlotLabel -> "Bird's Nest"]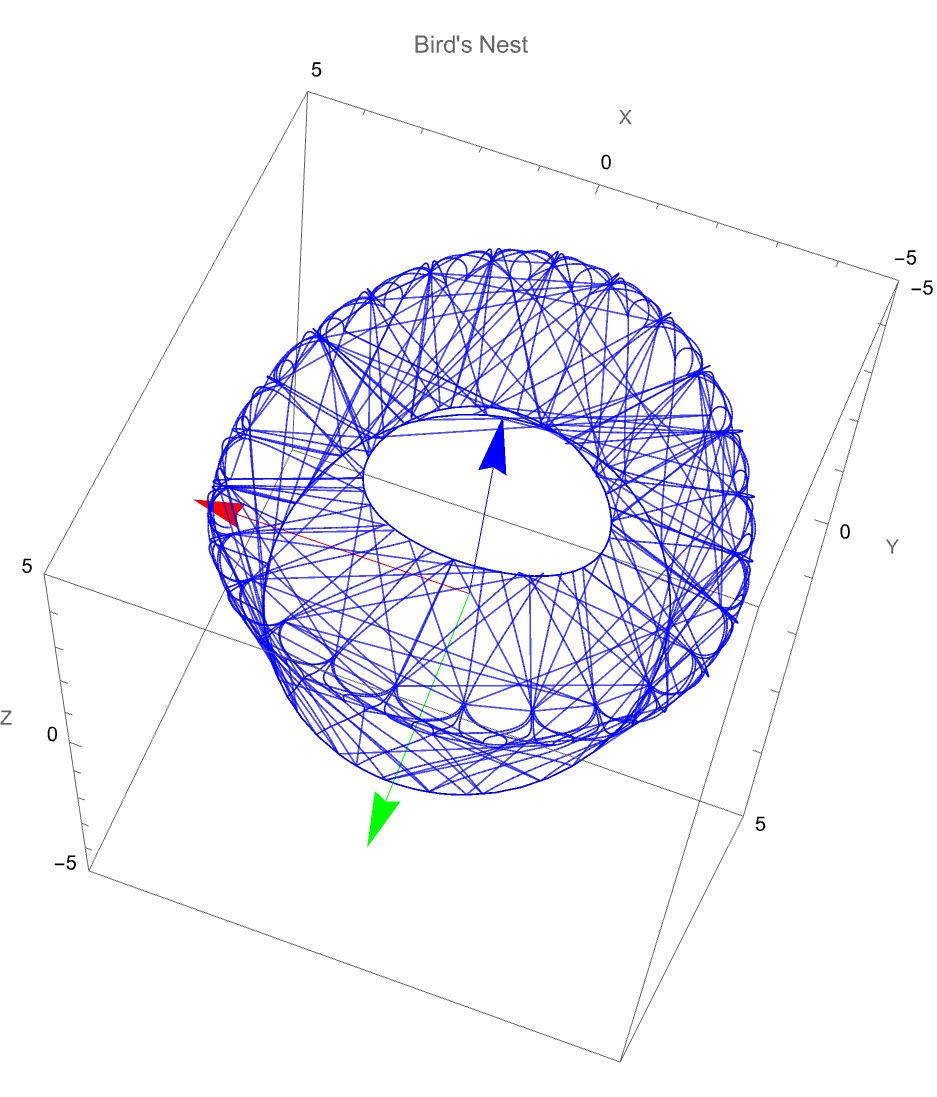
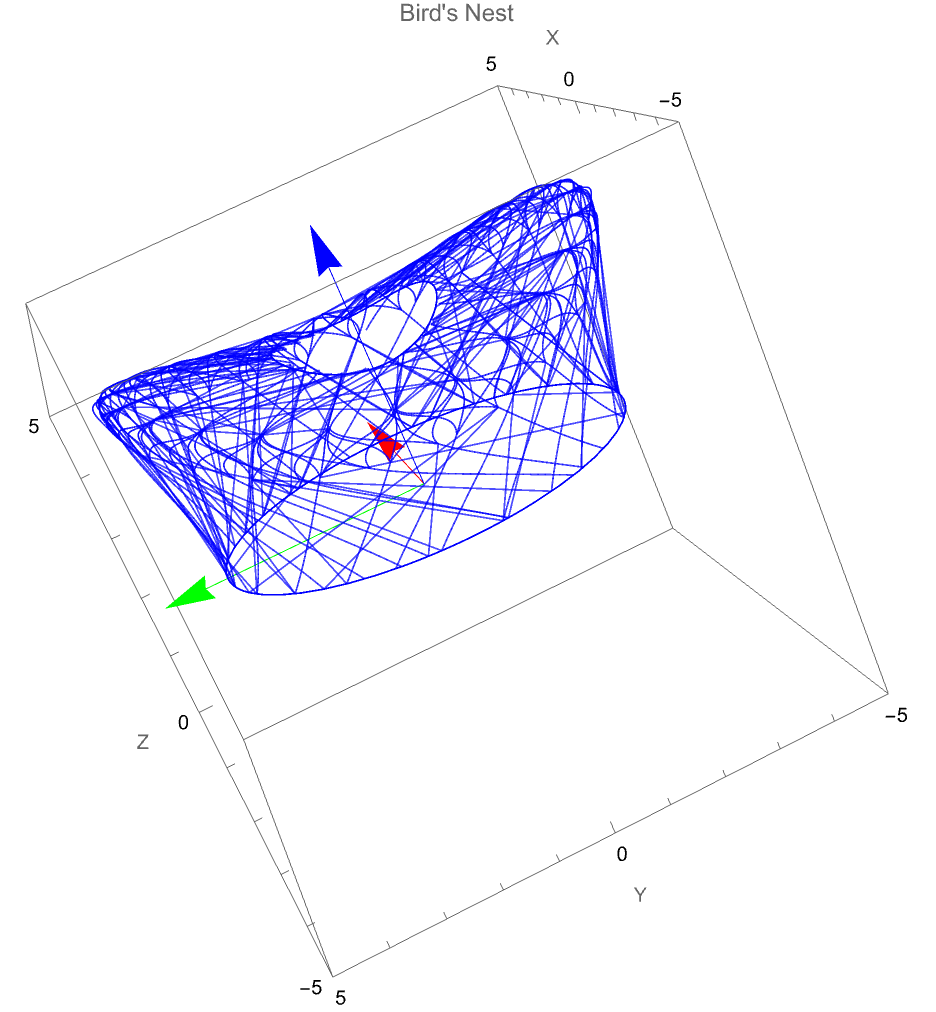
最终效果:
借助 Ai 工具,一步步很容易实现最后的效果,也了解 Mathematica 在 3d 方面使用方法,但最终效果还是过于有规律,mark 一下,后续尝试在 manim 实现这个效果。